 | EasyChair Smart Slide | User Guide/Log in |
| Home |

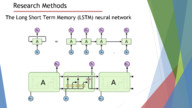
In this study, we consider the relationship between oil and gas prices, the Dow Jones index, the US dollar index and their volatility indicators. Application of wavelet analysis allows to reveal regularities of dynamics of selected time series at different periods. The Wavelet approach makes it possible to determine how these variables interact at different frequencies, and how this interaction evolves over time on different frequency scales. Common revenue movements of the studied time series characterize the behavior of the relevant markets. The levels of high volatility at similar intervals explain that there is a link between the changes in these markets, and the global economy is vulnerable to oil and gas prices, the value of the dollar index and the Dow Jones index. At the next stage of the research, a comparison of the predictive capabilities of Long Short Term Memory and Wavelet based Back Propagation neural networks for co-movement leaders is made.


